

Overview
GNSS interference can change rapidly. Understanding the operating environment therefore requires more than identifying where GNSS quality is currently degraded. Analysts also need to understand when conditions changed, how quickly they changed, and how those changes developed geographically over time.
Using Atlas, a change in GNSS quality was observed in a cell on the Caspian coast near the Azerbaijan–Russia border.
Over a three-hour period, the cell's GNSS quality metric declined from approximately 84/100 to 54/100, providing a clear example of how temporal analysis can reveal a developing change that may be less apparent from a single snapshot.
The observation
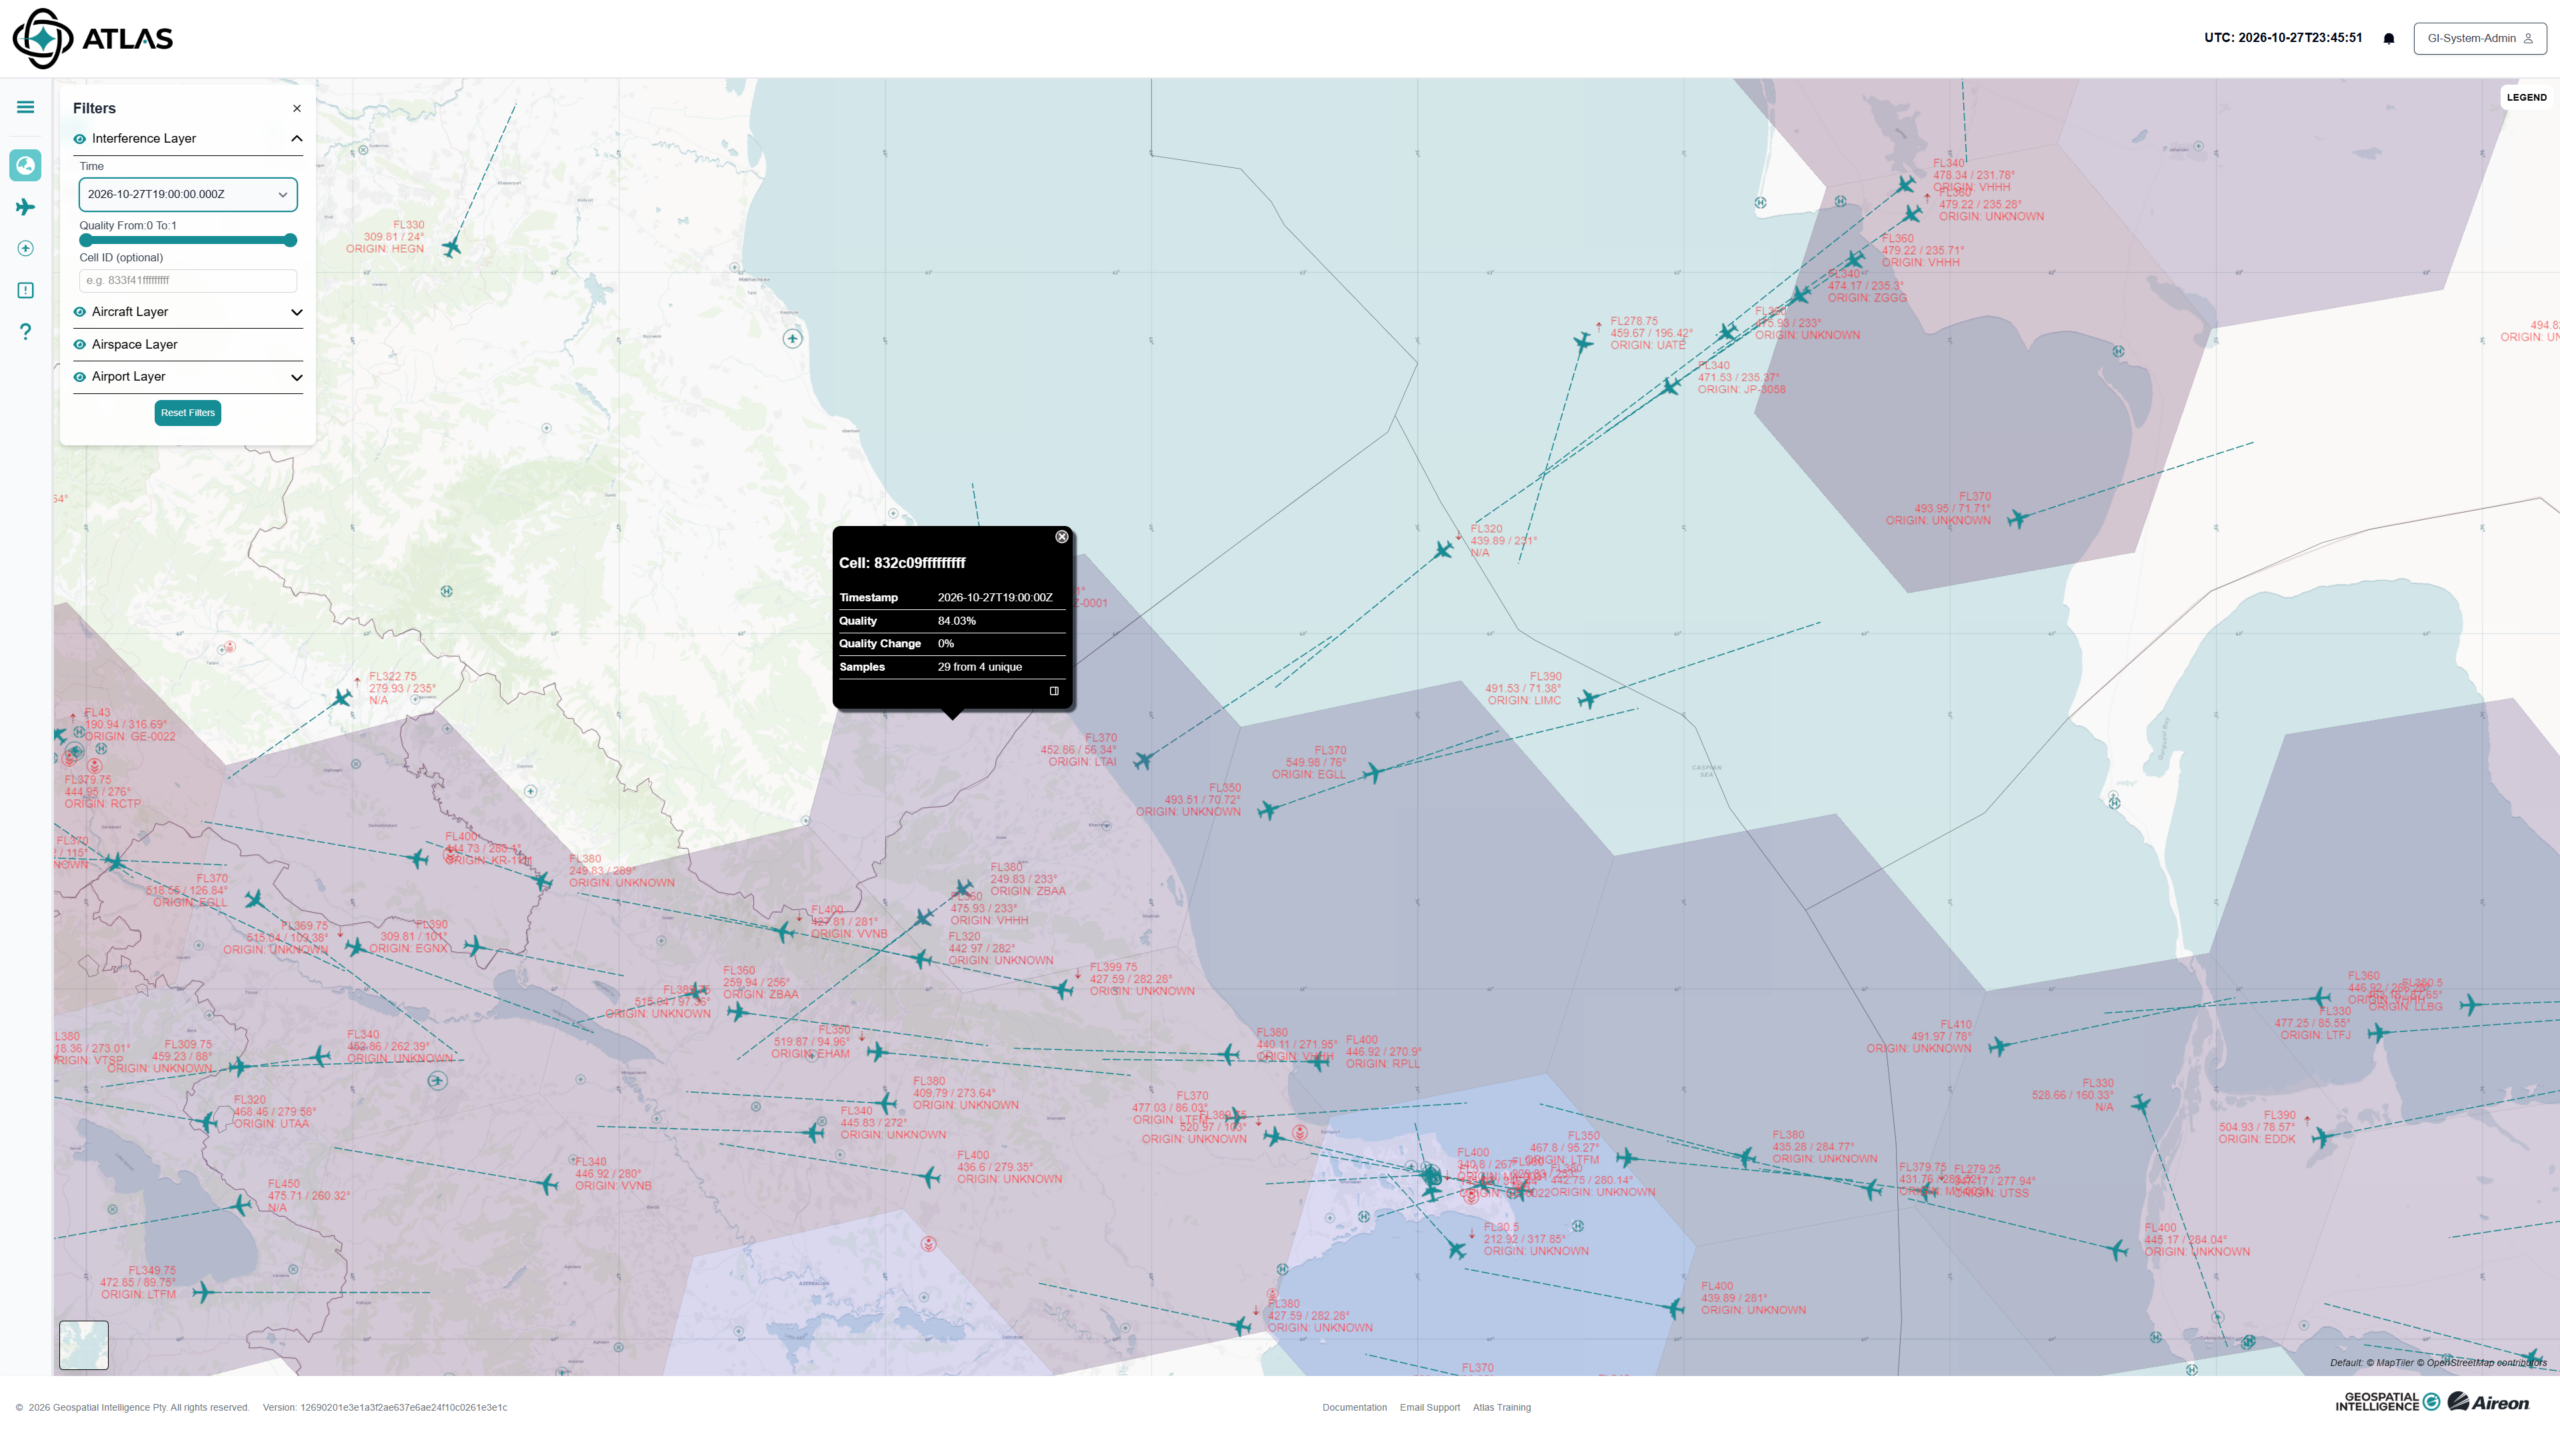
At 19:00Z, Atlas reported a GNSS quality metric of approximately 84/100 for the selected cell. The cell was displayed blue, with the metric indicating comparatively normal GNSS conditions.
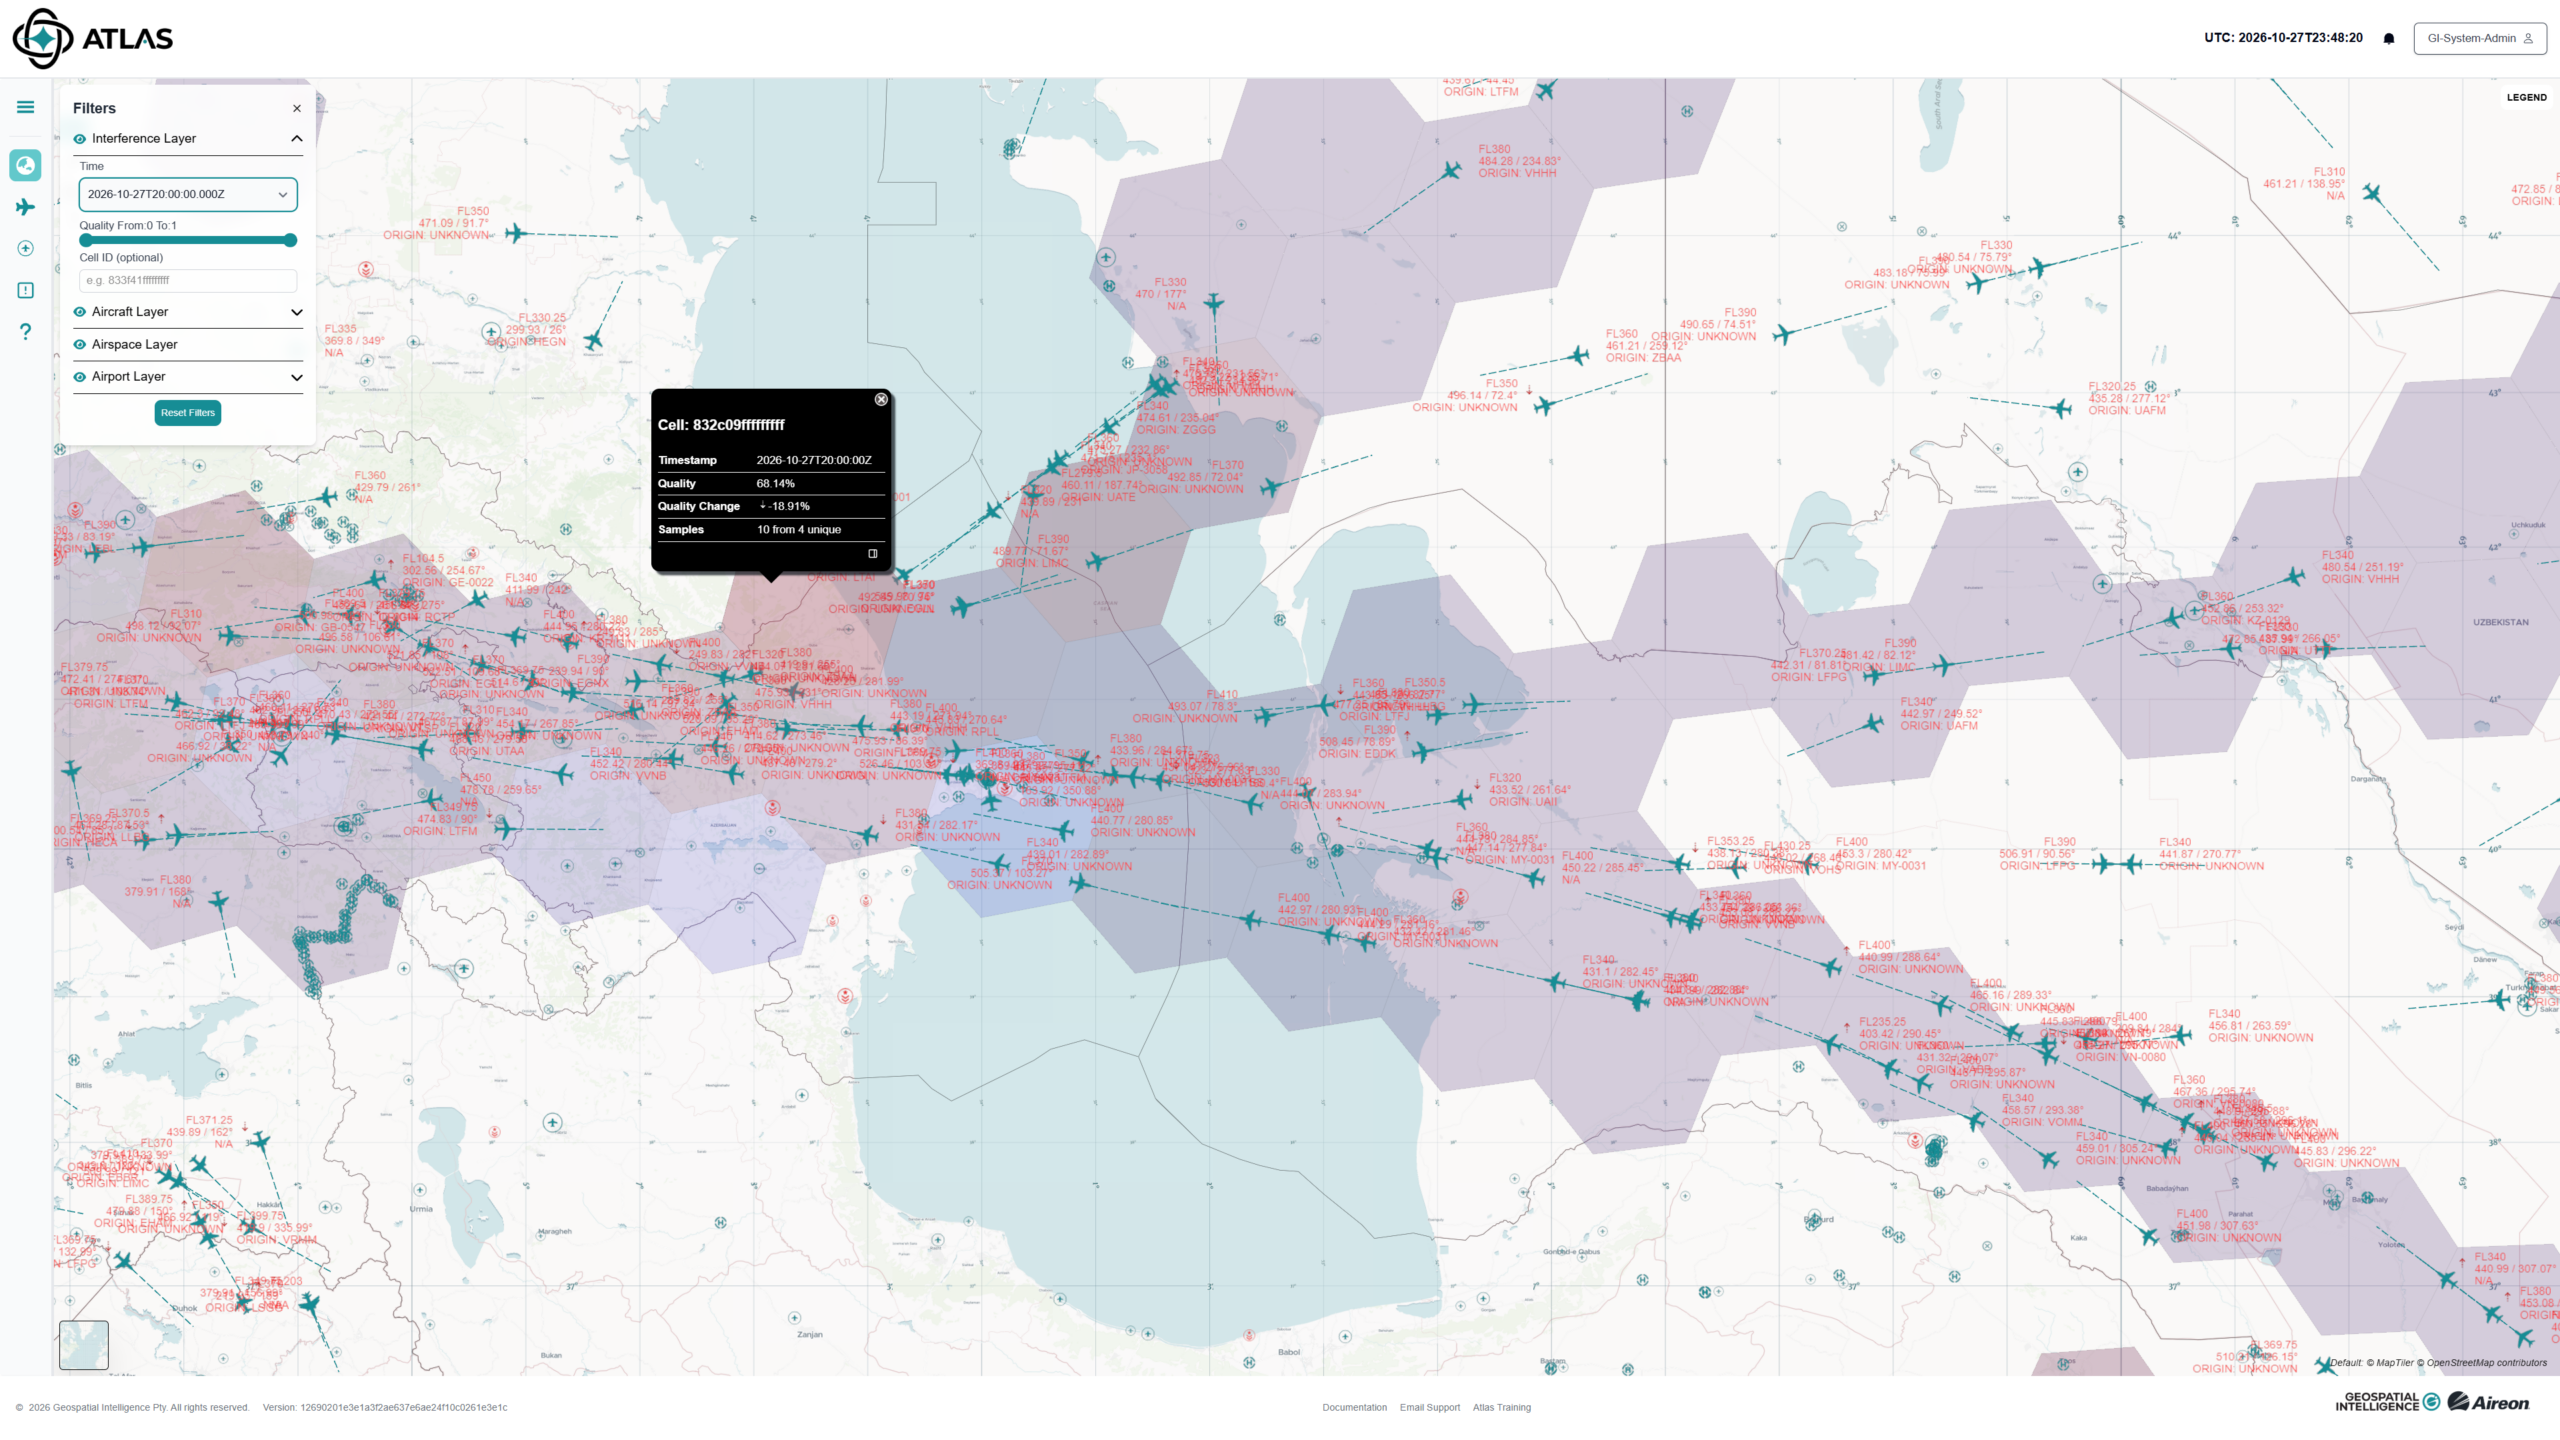
By 20:00Z, the quality metric had fallen to approximately 68/100, representing a substantial change from the previous observation.
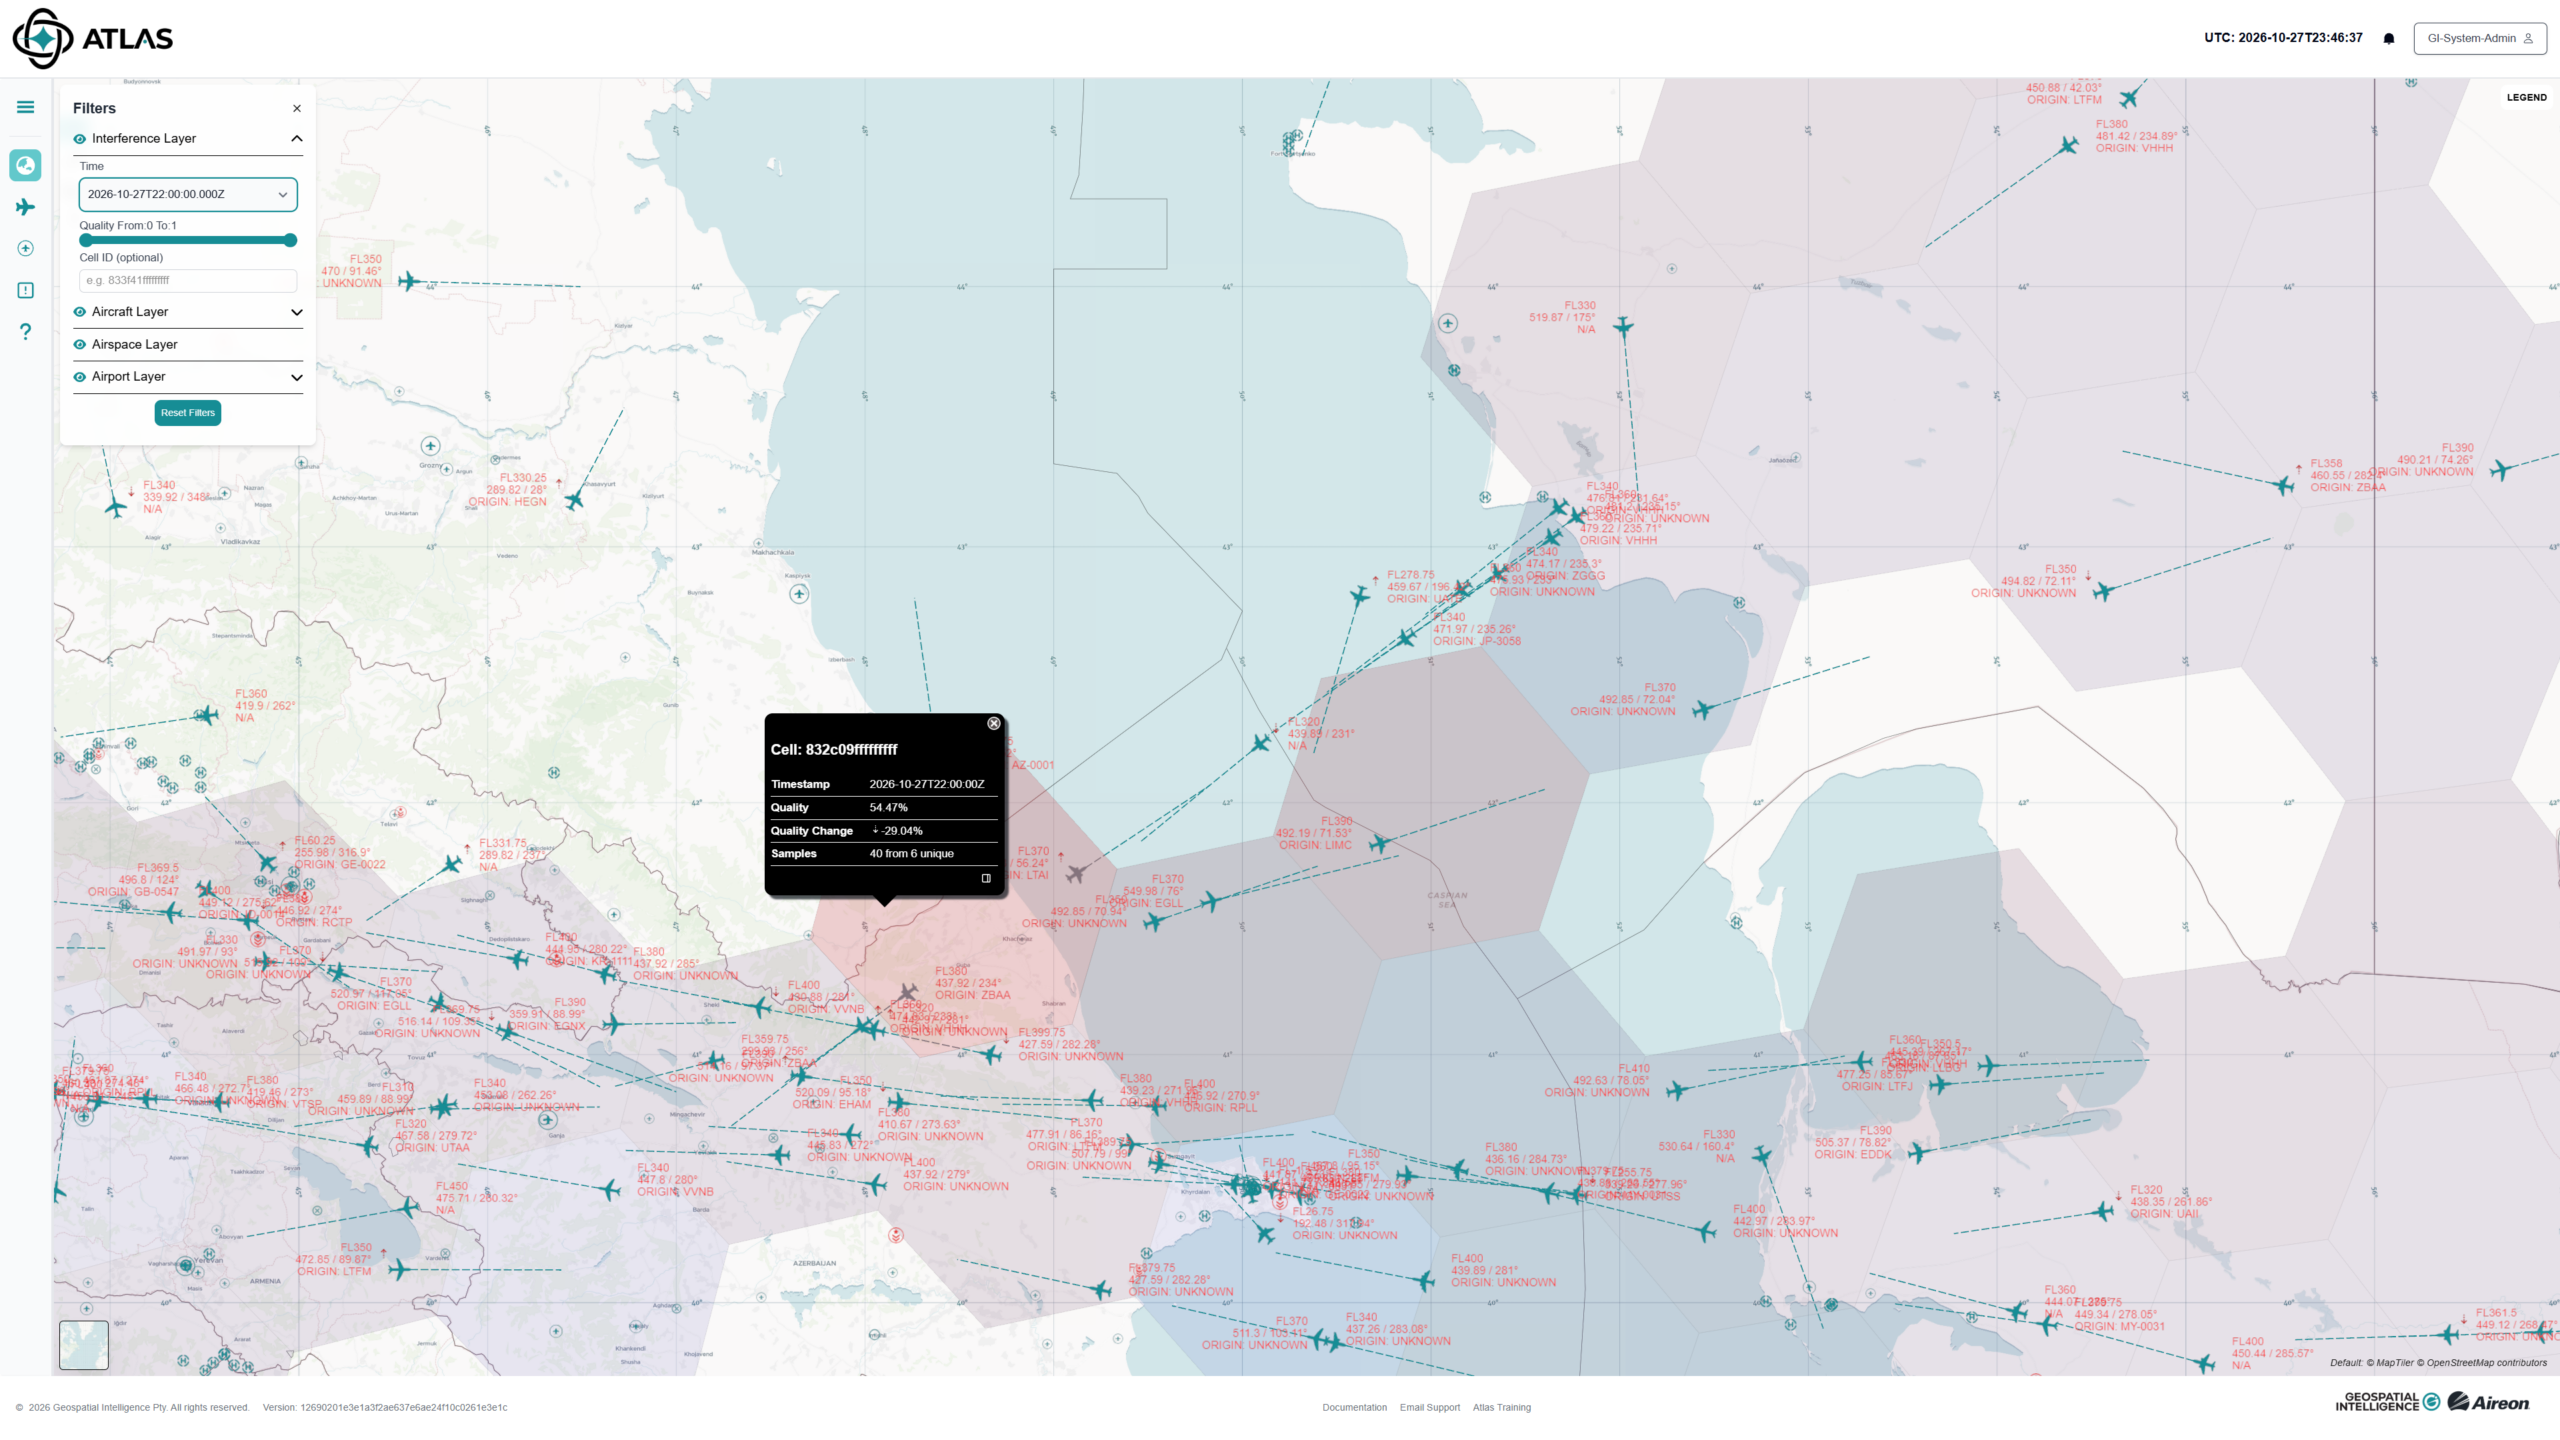
At 22:00Z, conditions had deteriorated further, with the cell reporting a quality metric of approximately 54/100.
Three hours of change
19:00Z | ~84/100
Relatively normal GNSS quality
↓ ~16-point decline
20:00Z | ~68/100
GNSS quality degradation evident
↓ ~14-point decline
22:00Z | ~54/100
Further degradation observed
Overall, the selected cell moved from approximately 84 to 54, a decline of roughly 30 points in three hours.
Why the temporal picture matters
Viewed independently, the 22:00Z observation identifies an area experiencing degraded GNSS quality.
Viewed as a sequence, however, the data provides considerably more context.
The earlier Atlas observations establish that the cell was reporting comparatively normal conditions at 19:00Z before deteriorating through 20:00Z and 22:00Z.
This allows an analyst to move beyond:
Where is GNSS quality degraded?
and begin investigating:
When did the degradation emerge, how quickly did it develop, and what was happening around it?
This temporal context can provide a more useful starting point for investigating changes in the GNSS environment.
From detection to investigation
The observation also demonstrates an important distinction.
Degradation isn't attribution.
The Atlas quality metric shows that the observed GNSS environment changed significantly during the period examined. The metric alone does not establish the cause of that change or identify a source.
Instead, the observed degradation provides an indicator that can focus further analysis.
An analyst can investigate the event in its spatial and temporal context, examining how conditions develop across successive observations rather than drawing conclusions from a single point in time.
Operational value
For users who depend on GNSS, understanding that change can be as important as identifying degradation itself.
A spatial view provides the where.
A temporal view adds the when and how quickly.
Together, those perspectives provide greater context for understanding an evolving GNSS environment and deciding where further investigation should be focused.
Key takeaway
This example demonstrates the value of monitoring GNSS quality as a dynamic geospatial phenomenon rather than a static map layer.
In this case, Atlas captured a progression from approximately:
84 → 68 → 54
in three hours.
By bringing location and time together, Atlas can help analysts identify changes in GNSS quality and build a clearer picture of how the observed environment evolves.